Current Stats
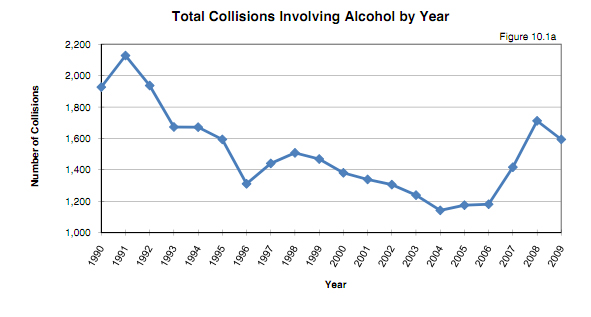
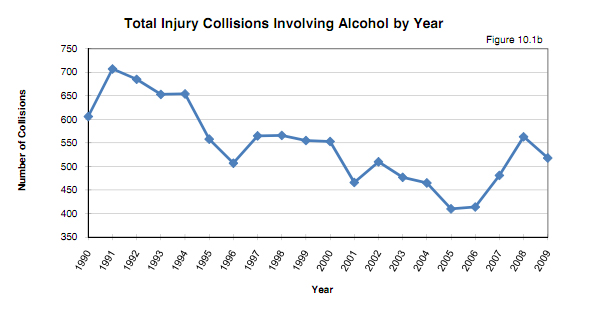
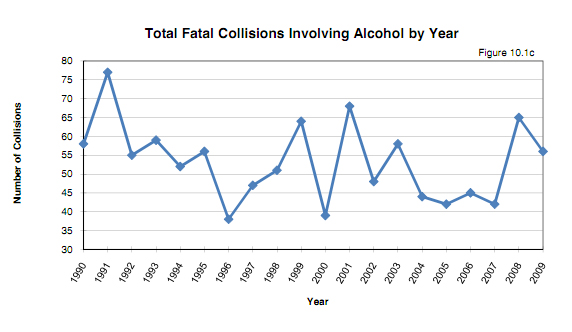
Alcohol Involved Fatal Collisions In Saskatchewan - 1990 to 2009
| NUMBER OF COLLISIONS | NUMBER OF VICTIMS | |||||||||||
| YEAR | PROPERTY DAMAGE | PERSONAL INJURY | FATAL | TOTAL | INJURED | KILLED | TOTAL | |||||
| 1990 | 1263 | 606 | 58 | 1927 | 1036 | 65 | 1101 | |||||
| 1991 | 1344 | 707 | 77 | 2128 | 1215 | 88 | 1303 | |||||
| 1992 | 1197 | 685 | 55 | 1937 | 1265 | 64 | 1329 | |||||
| 1993 | 961 | 653 | 59 | 1673 | 1126 | 70 | 1196 | |||||
| 1994 | 966 | 654 | 52 | 1672 | 1142 | 57 | 1199 | |||||
| 1995 | 680 | 558 | 56 | 1294 | 991 | 61 | 1052 | |||||
| 1196 | 766 | 507 | 38 | 1311 | 901 | 47 | 948 | |||||
| 1997 | 829 | 565 | 47 | 1441 | 1062 | 58 | 1120 | |||||
| 1998 | 891 | 566 | 51 | 1508 | 1013 | 59 | 1072 | |||||
| 1999 | 850 | 555 | 64 | 1469 | 993 | 86 | 1079 | |||||
| 2000 | 789 | 553 | 39 | 1381 | 951 | 47 | 998 | |||||
| 2001 | 805 | 466 | 68 | 1339 | 835 | 79 | 914 | |||||
| 2002 | 748 | 510 | 48 | 1306 | 821 | 51 | 872 | |||||
| 2003 | 704 | 477 | 58 | 1239 | 807 | 63 | 870 | |||||
| 2004 | 633 | 465 | 44 | 1142 | 799 | 53 | 852 | |||||
| 2005 | 723 | 410 | 42 | 1175 | 670 | 46 | 716 | |||||
| 2006 | 722 | 414 | 45 | 1181 | 745 | 46 | 791 | |||||
| 2007 | 894 | 481 | 42 | 1417 | 871 | 46 | 917 | |||||
| 2008 | 1084 | 563 | 65 | 1712 | 1000 | 76 | 1076 | |||||
| 2009 | 1020 | 518 | 56 | 1594 | 878 | 66 | 944 | |||||
| Minimum reporting limits for property damage only collisions were $200 prior to 1984, $500 as of Jan. 1, | ||||||||||||
| 1984 and $1,000 as of Jan. 1, 1993. | ||||||||||||
| Alcohol involvement in fatal traffic collisions is confirmed through the reporting police agency and Coroner's | ||||||||||||
| Office after all investigation and lab testing has been completed. This procedure is not done for injury and | ||||||||||||
| property damage only collisions. | ||||||||||||
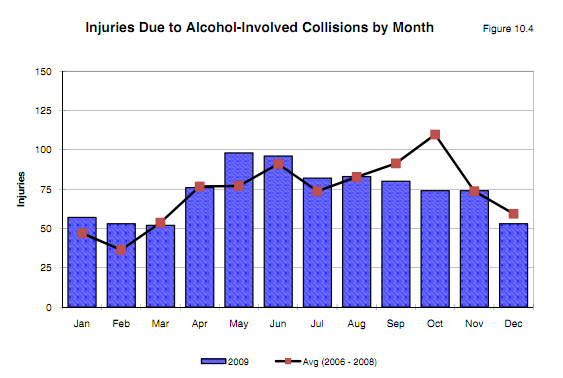
Injuries Due to Alcohol-Involved Collisions by Month and Year
| Month | 2004 | 2005 | 2006 | 2007 | 2008 | Average | 2009 | % |
| 2006-2008 | Change | |||||||
| January | 37 | 53 | 34 | 54 | 53 | 47 | 57 | 21.3 |
| February | 38 | 22 | 42 | 35 | 32 | 36.33 | 53 | 45.9 |
| March | 52 | 50 | 44 | 56 | 61 | 53.67 | 52 | -3.1 |
| April | 89 | 42 | 76 | 88 | 66 | 76.67 | 76 | -0.9 |
| May | 78 | 50 | 62 | 80 | 89 | 77.00 | 98 | 27.3 |
| June | 78 | 38 | 83 | 103 | 87 | 91.00 | 96 | 5.5 |
| July | 92 | 101 | 72 | 51 | 98 | 73.67 | 82 | 11.3 |
| August | 75 | 77 | 80 | 73 | 95 | 82.67 | 83 | 0.4 |
| September | 65 | 48 | 61 | 97 | 116 | 91.33 | 80 | -12.4 |
| October | 78 | 69 | 95 | 92 | 142 | 109.67 | 74 | -32.5 |
| November | 75 | 50 | 58 | 59 | 104 | 73.67 | 74 | 0.5 |
| December | 42 | 70 | 38 | 83 | 57 | 59.33 | 53 | -10.7 |
| Totals | 799 | 670 | 745 | 871 | 1000 | 872 | 878 | 52.6 |
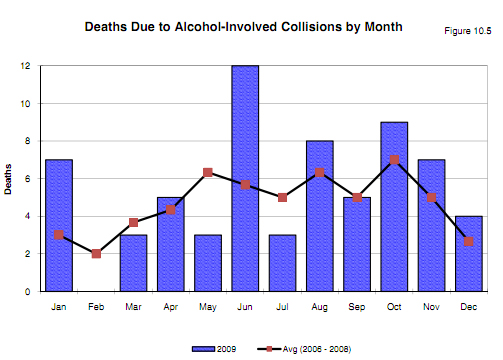
Injuries Due to Alcohol-Involved Collisions by Month and Year
| Month | 2004 | 2005 | 2006 | 2007 | 2008 | Average | 2009 | % |
| 2006-2008 | Change | |||||||
| January | 2 | 1 | 4 | 1 | 4 | 3.0 | 7 | 133.3 |
| February | 2 | 0 | 3 | 0 | 3 | 2.0 | 0 | -100 |
| March | 5 | 2 | 1 | 5 | 5 | 3.7 | 3 | -18.2 |
| April | 6 | 3 | 4 | 3 | 6 | 4.3 | 5 | 15.4 |
| May | 2 | 8 | 8 | 5 | 6 | 6.3 | 3 | -52.6 |
| June | 3 | 6 | 0 | 6 | 11 | 5.7 | 12 | 111.8 |
| July | 7 | 6 | 5 | 3 | 7 | 5.0 | 3 | -40 |
| August | 7 | 5 | 3 | 7 | 9 | 6.3 | 8 | 26.3 |
| September | 7 | 3 | 6 | 2 | 7 | 5.0 | 5 | 0 |
| October | 7 | 3 | 3 | 7 | 11 | 7.0 | 9 | 28.6 |
| November | 4 | 4 | 4 | 5 | 6 | 5.0 | 7 | 40 |
| December | 1 | 5 | 5 | 2 | 1 | 2.7 | 4 | 50 |
| Totals | 53 | 46 | 46 | 46 | 76 | 56.0 | 66 | 17.9 |
You can see all the detailed information about these charts here.
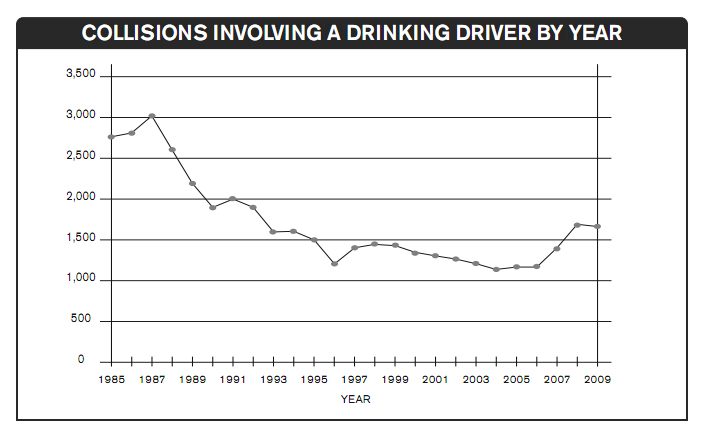
Collisions Involving Alcohol - 1985-2009
Casualties by Road User Class - 2004-2009
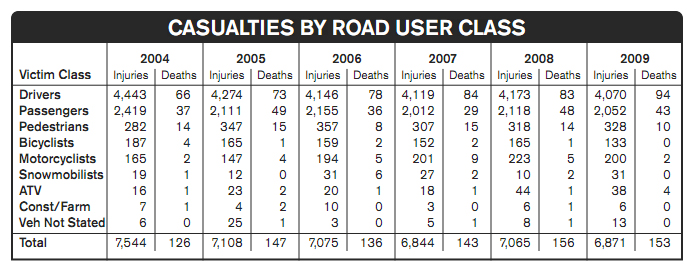
You can see all the detailed information about these charts here.
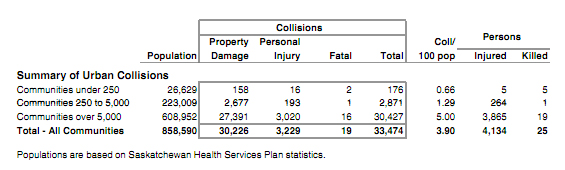
Summary of Urban Collisions
2009 Traffic Collisions By Rural Municipality
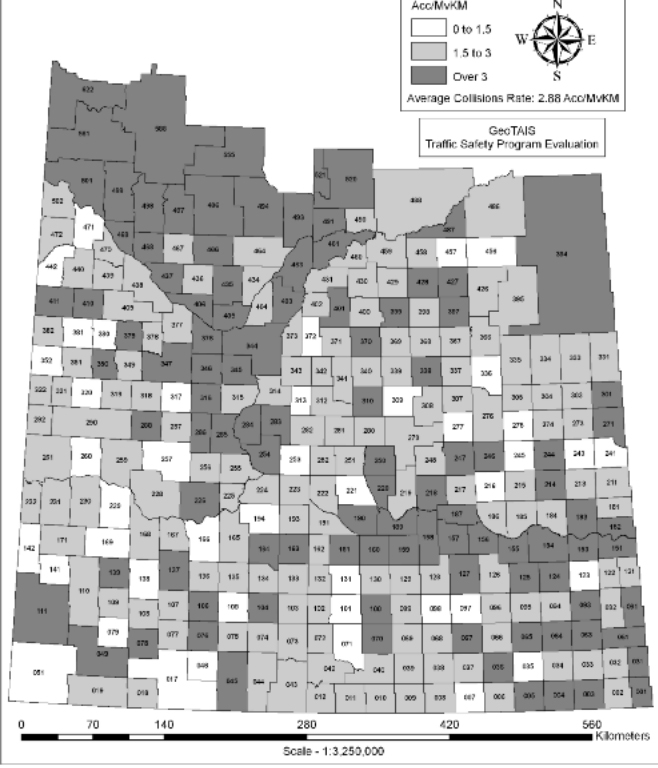
Get extremely detailed information about what this map means here.
Need more info?
If you are looking for more information about our programs, please use the menu to the left or email the provincial office at sadd@sasktel.net